
What is Product Analytics?
Product analytics is the process of analyzing and understanding the users’ interaction with your product. It enables product managers to monitor the product’s performance and the user’s behavior to improve the user experience.
Today, product analytics is a vital tool for any organization that wants to create successful products. It offers business leaders insight into users’ needs and brings them value.
Experiment velocity for PMs
Statistical significance for PMs
A/B test sample size for PMs
Product analytics instrumentation for PMs
HEART framework for product managers
Pirate metrics AARRR for product managers
Cohort analysis for product managers
North star metric for product managers
Churn prevention for product managers
Experiment design for product managers
Product analytics for beginners
Activation metric for product managers
What are the Purposes of Product Analytics?
Product analytics is a user center technique that allows business leaders to understand their products better. Following are the main purposes of product analytics:
- It aims to collect data on user engagement with your products to analyze and improve the user experience.
- It helps the product team to create product designs that meet user needs by studying their behavior and understanding their preferences.
- It enables you to discover what features users find valuable and use most often.
- It also aims to identify the shortcomings of a product and allow product managers to take corrective measures.
What are Product Analytics Examples?
Here are some examples of product analytics:
Trend Analysis
Trend analysis is a comprehensive report that contains data related to trends over time. It offers you an opportunity to assess the feature adoption rate. It provides you insight into whether certain market trends continue to grow or if they are becoming less popular. You can also learn about any new emerging trends in the market. The trend analysis report can help the marketing team decide where to allocate their resources.
It is a common analysis, and various departments use it. Let’s explore how various teams use it:
- Product teams use trend analysis to assess how new features perform over time. They can also use it to identify any issues with the product.
- Marketing teams employ it to analyze the user journey and identify any areas where users drop off.
- UX designers can use trend analysis to understand how users interact with the product and identify user behavior patterns.
Journey Analysis
Journey analysis is a type of product analytics that focuses on understanding the user’s journey. It helps product managers to see the product from a user’s eye. User journey refers to the steps users take while interacting with your product to achieve a goal. Journey analysis helps you understand how users discover and use your product.
Journey analysis also allows you to identify any areas where users are struggling. Journey analysis involves mapping the user’s journey and identifying pain points. It can help improve the user experience by making it more seamless.
Attribution Analysis
Attribution analysis enables you to pinpoint the user touchpoints attributing to the product’s success. User touchpoints are the interactions a user has with your product. Attribution analysis helps you understand which touchpoints led to conversions.
It is a valuable tool for marketing teams as it helps them understand which channels drive the most conversions. It also helps the product teams to assess the impact of new features on conversion rates.
How to Implement Product Analytics?
Here are the steps of the product analytics implementation process:
Determine Business Goals
The first step of implementing product analytics is to determine the business goals. Business goals and objectives are crucial to any organization as they guide the decision-making process. You need to decide what your organization wants to achieve with the product
The business goals will differ from organization to organization. However, some common business goals include increasing revenue, reducing costs, and improving customer satisfaction. Determining the business goals will help you choose the right metrics.
Identify Product Analytics Metrics
Product analytics metrics refer to the data points you need to track to assess the performance of your product. There are various metrics, but not all will be relevant to your business goals. Following are some key metrics that can help you in measuring the performance of your product:
- User engagement metric: It helps track how often users use your product over time. It enables you to gauge whether users are finding your product helpful.
- Retention rate: It is the percentage of users who continue to use your product over a period of time.
- Conversion rate: It is the percentage of users who take the desired action, such as making a purchase.
- Churn rate: It is the percentage of users who stop using your product over a period of time.
- Revenue per user: It helps you track how much revenue each user is generating.
Define Data Management
Data management is an essential step of product analytics implementation. It involves collecting, storing, and processing data.
- Collecting data is the first step of data management. You must determine what data needs to be collected and how it will be collected. You can collect data through various channels, like customer interviews, surveys, and web analytics tools.
- The next step is to store the collected data. Data should be stored in a secure location, like a data warehouse. A data warehouse is a database that stores data from multiple sources. It helps you to keep track of the data and to access it easily.
- The last step of data management is data processing. Data processing involves cleaning and organizing data. This step is essential as it helps you to make sense of the data. Data processing is a time-consuming task, but it is necessary to ensure that the data is accurate
Employing data management platforms like Salesforce DMP, Cloudera, and Lotame can automate data collection, processing, and organization.
Decide on Product Analytics Instrumentation
Product analytics instrumentation is the process of defining data sources and tracking user behavior and interactions with the product. Product managers use product analytics instrumentation to make decisions about tracking product usage. Product managers involve other stakeholders in this step to ensure everyone is on the same page.
Implement Data Governance
Data governance ensures the accuracy, consistency, and accessibility of data. It helps to ensure that the data collected is relevant and can be used to make decisions. Data governance is a crucial step of product analytics implementation as it helps to ensure that the data collected is accurate and can be used to make decisions.
Product leaders must involve all the stakeholders in data governance. They need to define the roles and responsibilities of each stakeholder. They also need to create policies and procedures for data governance to ensure everyone understands their role.
Implement Product Integration
Product integration is the process of integrating the product analytics platform with other systems. Product managers use integration tools to collect data from multiple sources and to track user behavior. Here are some popular data integration tools:
- Zendesk: It helps to collect customer data from multiple channels, like email, chat, and social media.
- Mixpanel: It helps to track user behavior and to understand how users interact with the product.
- Salesforce CRM: It helps to track customer data and to understand customer behavior.
Get Help from Success Stories
Success stories are a great way to learn from other companies that have already implemented product analytics. By reading case studies, you can learn about the challenges and achievements of other companies. It will help you to avoid making the same mistakes and to learn from the accomplishments of others.
What are Product Analytics Tools?
Here are some popular product analytic tools:
Google Analytics
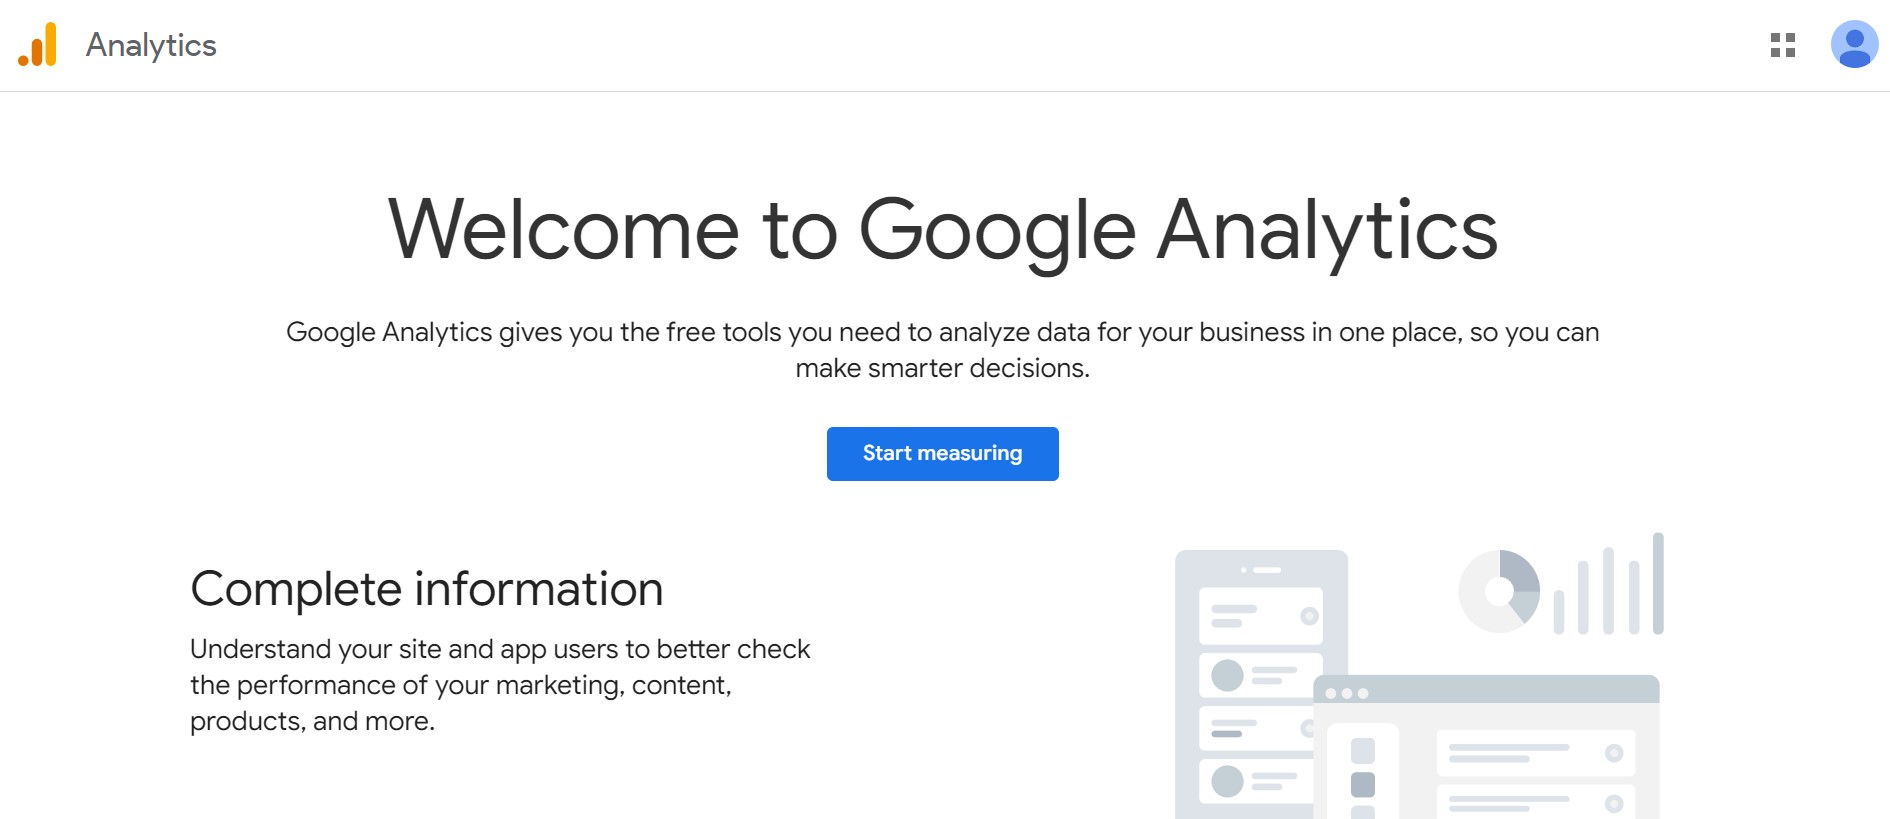
It is one of the first ever product analytical tools widely used by product analysts to track its performance. It is a free tool that provides insights into website traffic. Google Analytics is also used to track user behavior and to understand how users interact with the product.
Visit Google Analytics here.
Amplitude Analytics
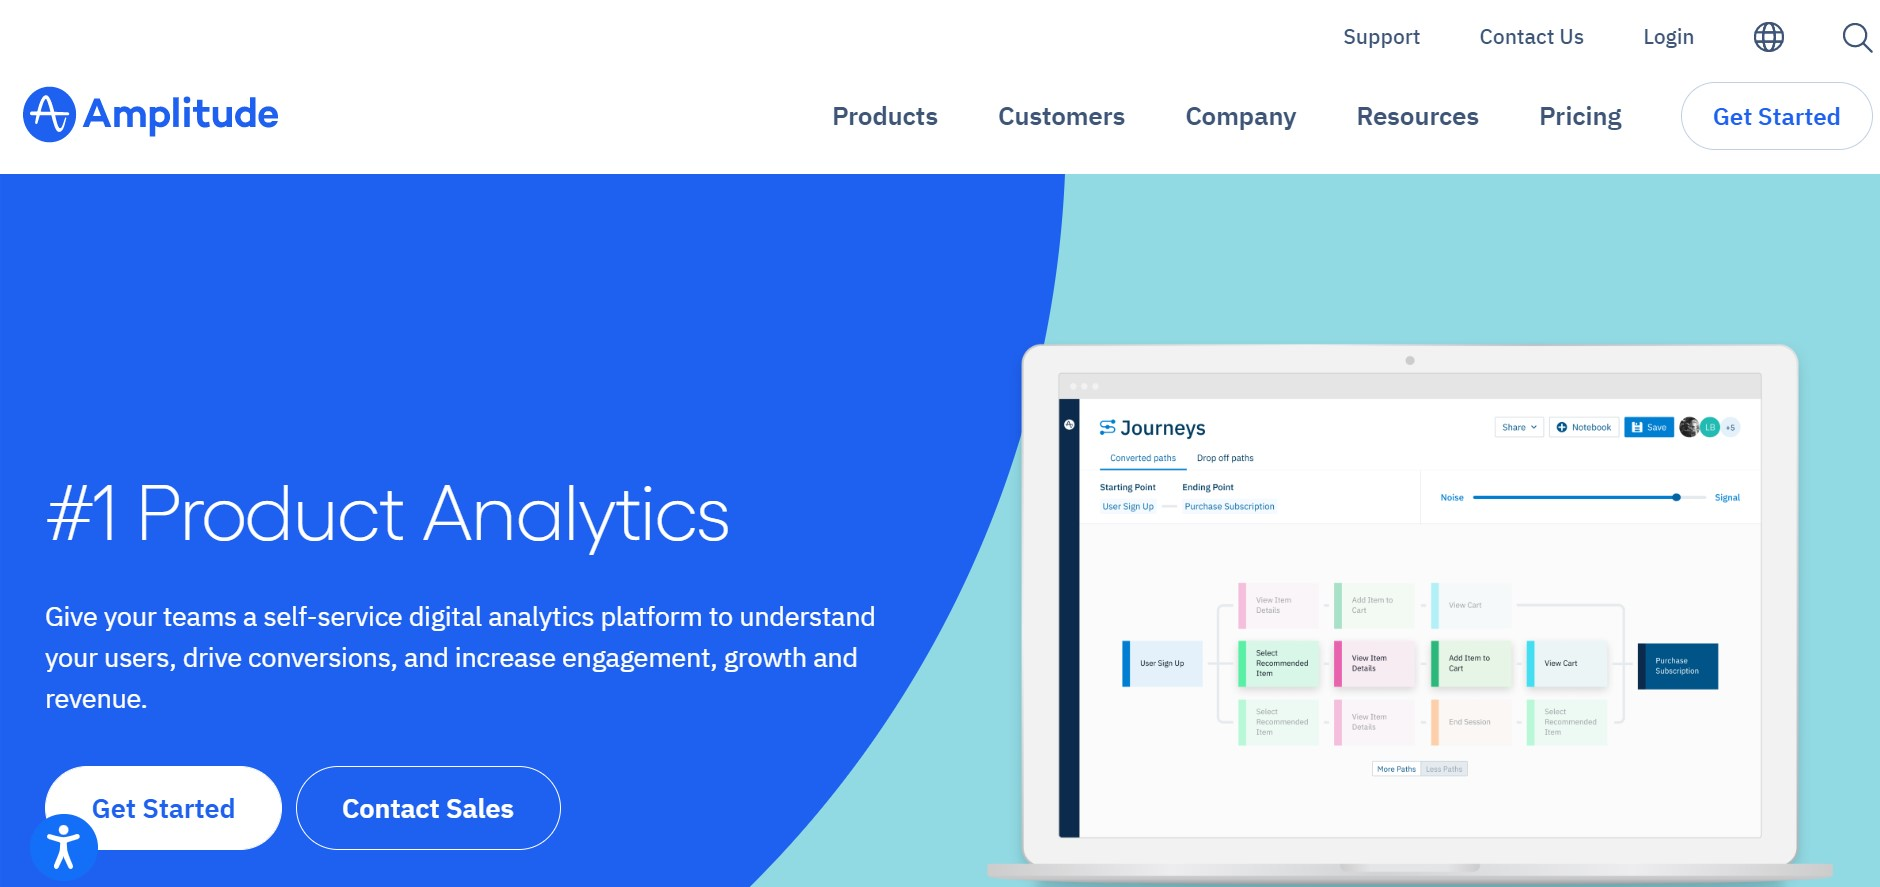
It is a digital product analytics tool that helps companies to track user behavior and to understand how users interact with the product. It provides insights into user engagement and conversion. It offers various features, including cross-platform tracking to capture all product analytics data.
Visit Amplitude Analytics here.
Heap
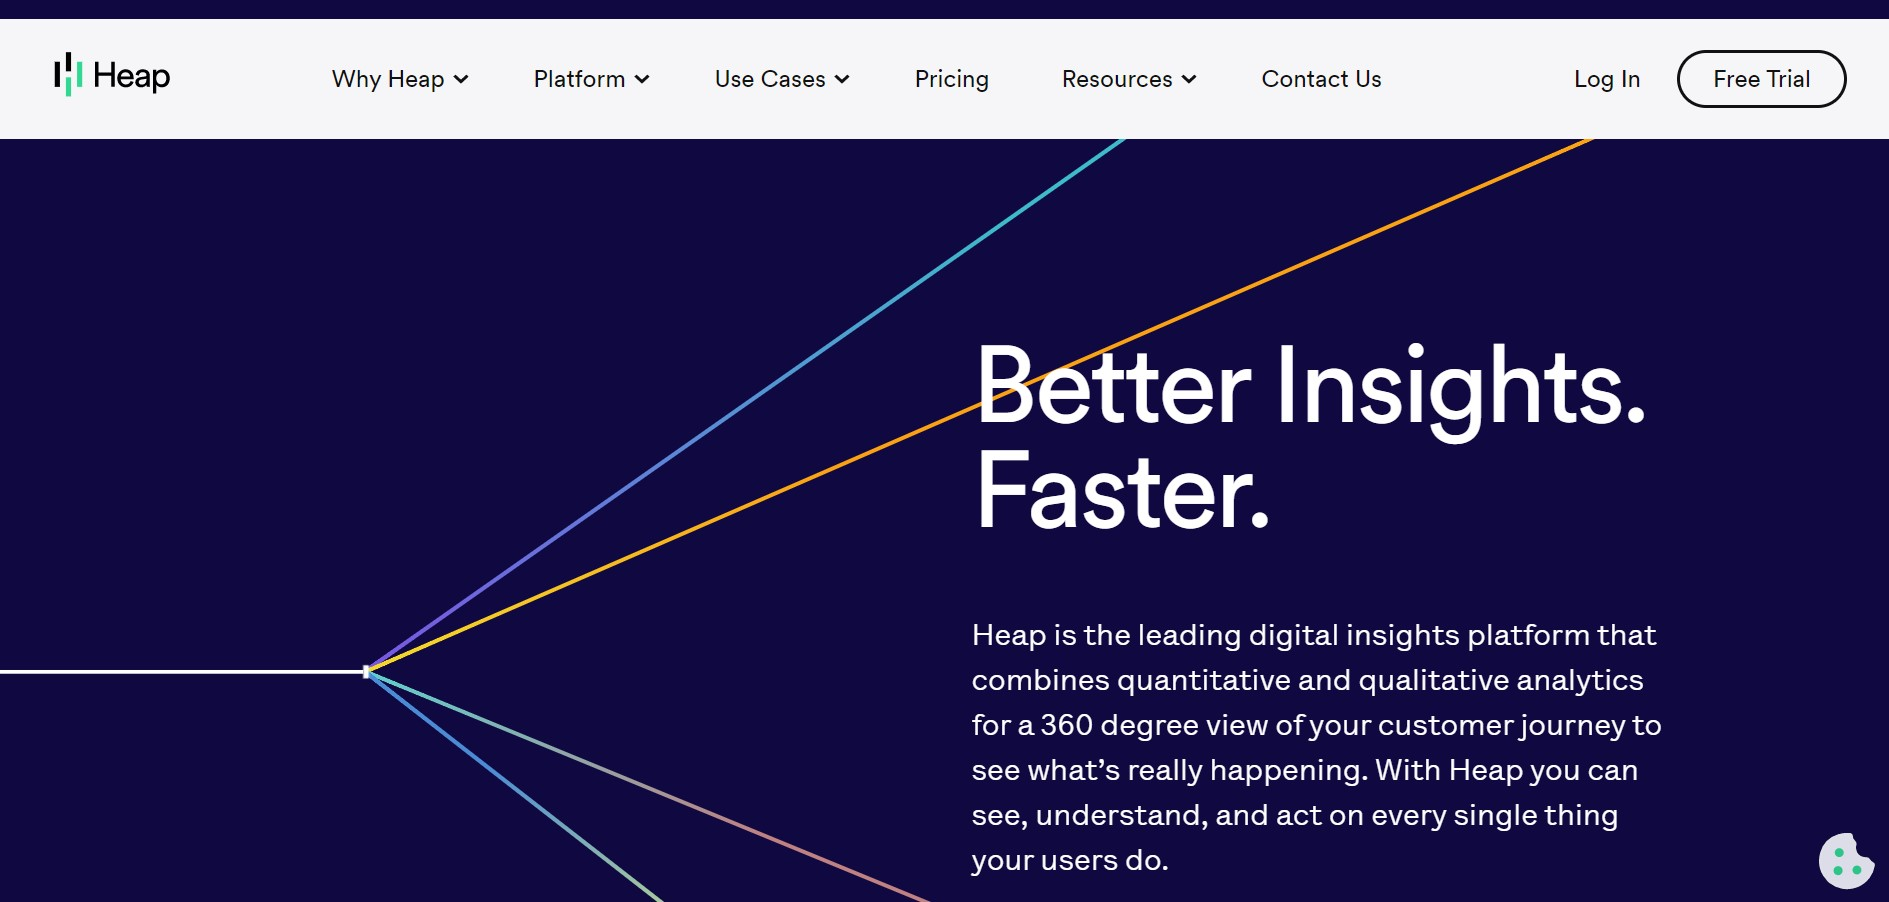
It is one of the best product analytics software tools that combine qualitative and quantitative data to provide insights into user behavior. It enables you to monitor each step of your user’s journey. Heap also offers features like automatic event tracking and conversion tracking.
Visit Heap here.
Pendo
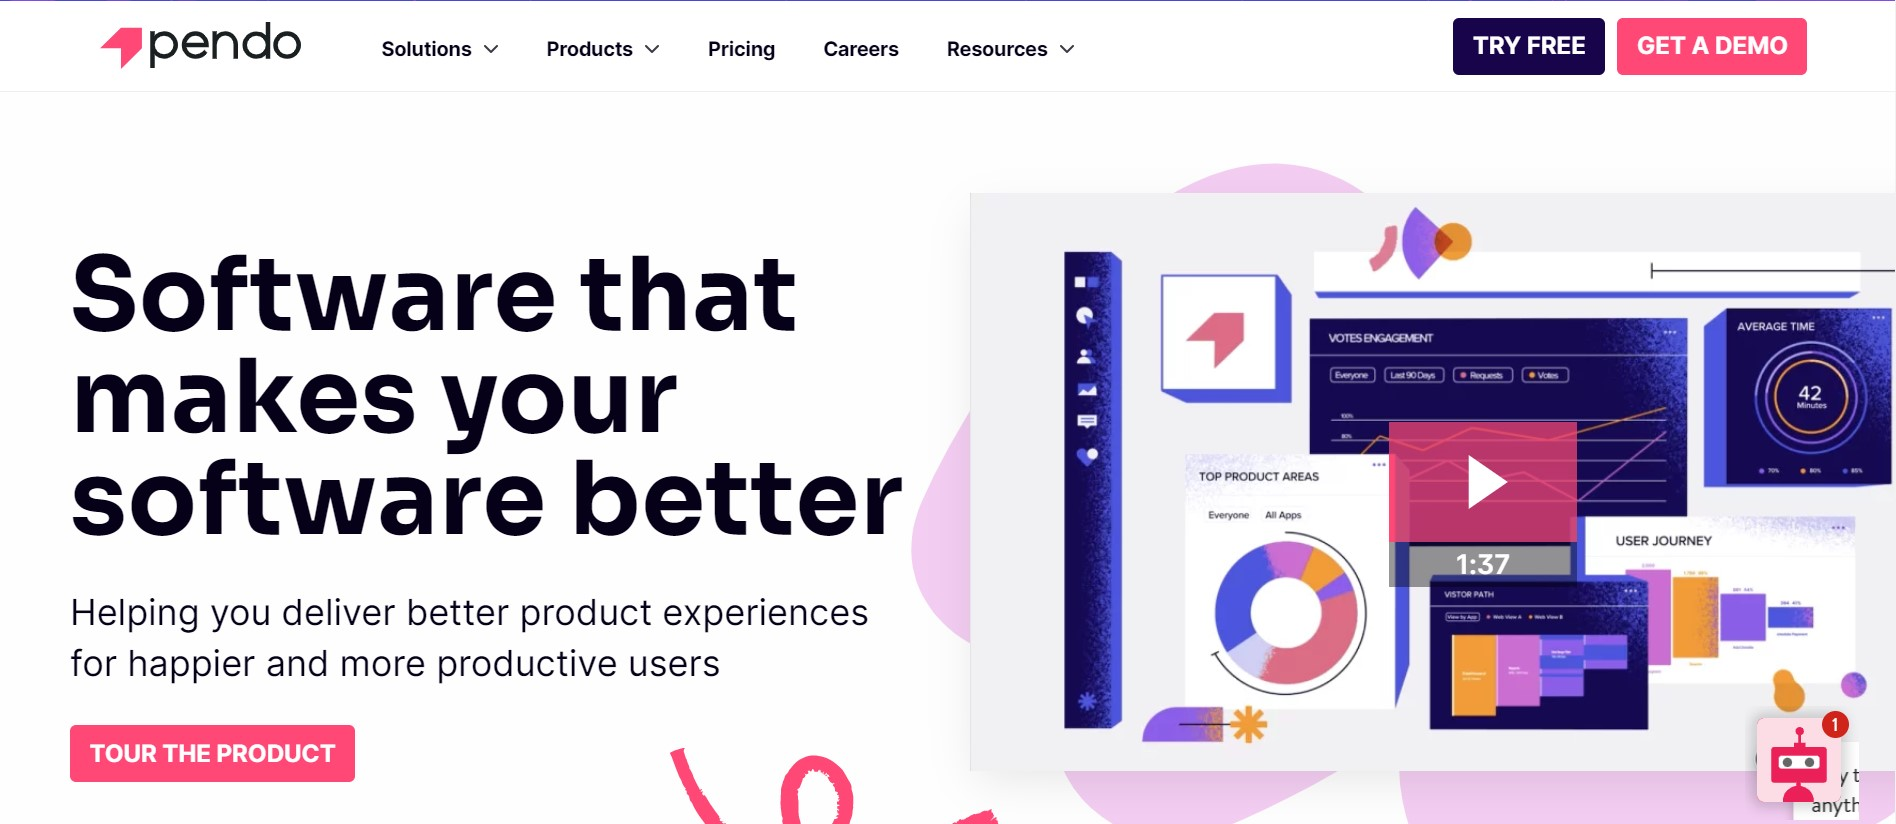
It is another popular product analytics solution that helps product managers to understand user behavior and to track user engagement. It provides an app-messaging feature that enables product teams to contact users and guide them through the product. It is available as a web and mobile app, which makes it more convenient for users.
Visit Pendo here.
Conclusion
Developing a high-end product is crucial for any business in this digital age. It enables enterprises to close more deals, get more customers, and generate more revenue. However, product development is not enough. A business must also focus on product analytics to ensure that the product is performing well.
Product analytics helps you identify issues and find ways to improve the product. It helps businesses get a competitive edge by providing insights into customer behavior. If you want your business to stay on the top, start using product analytics and develop a stunning product.
FAQs
Why are product analytics tools important?
Product analytics tools are important because they help businesses to understand user behavior and to track user engagement. They provide insights into user engagement and conversion. These tools allow companies to identify issues and find ways to improve their product. They also automate the complex process of data collection and analysis.
How do product analytics tools work?
Product analytic tools work by tracking user behavior and collecting data. This data is then analyzed to understand how users interact with the product. The insights generated help businesses improve their product and make them more user-friendly.